Категория:Моделирование рельефа: различия между версиями
Перейти к навигации
Перейти к поиску
(→lw:WOS Solution) |
(→solutions) |
||
| Строка 8: | Строка 8: | ||
= solutions = | = solutions = | ||
* [https://gisandscience.com/2009/11/18/geography-awareness-week-how-much-water-is-in-the-ocean/ The calculation of variations in the sea level is relatively simple. It is by far more complicated to then determine the change in the water mass. A team of geodesists and oceanographers from the University of Bonn, as well as from the GFZ German Research Centre for Geosciences and the Alfred-Wegener Institute for Polar and Marine Sciences, two centres of the Helmholtz Association, have now, for the first time succeeded in doing this. The researchers were able to observe short-term fluctuations in the spatial distribution of the ocean water masses.] | * [https://gisandscience.com/2009/11/18/geography-awareness-week-how-much-water-is-in-the-ocean/ The calculation of variations in the sea level is relatively simple. It is by far more complicated to then determine the change in the water mass. A team of geodesists and oceanographers from the University of Bonn, as well as from the GFZ German Research Centre for Geosciences and the Alfred-Wegener Institute for Polar and Marine Sciences, two centres of the Helmholtz Association, have now, for the first time succeeded in doing this. The researchers were able to observe short-term fluctuations in the spatial distribution of the ocean water masses.] | ||
| + | |||
| + | [https://www.sciencedaily.com/releases/2009/11/091112103419.htm we were able to prove, for the first time, that in particular in the higher latitudes, significant fluctuations of the water mass occur, and that this takes place within a time period of only one to two weeks". So far one only knew that the mass of the world-wide ocean water varies seasonally by on average approximately three quadrillion kilogrammes (a quadrillion equals to 1 followed by 15 zeroes) -- that implies a sea level variation of approx. seven to eight millimetres. This effect is brought about, among others, by variations in precipitation and evaporation as well as by the storage of water as snow. But, also, the melting of the glaciers and the ice masses in Greenland and in the Antarctic play a role.] | ||
| + | * [https://www.sciencedaily.com/releases/2017/01/170130224728.htm The movement of water in the ocean is determined by many factors including tides; winds; surface waves; internal waves, those that propagate within the layers of the ocean; and differences in temperature, salinity or sea level height. Additionally, like high and low pressure systems seen on TV weather maps, the ocean is full of eddies, slowly swirling masses of water... In the future, Qiu and colleagues hope to develop a mathematical approach to creating more detailed pictures of circulation based on sea level in more locations throughout the Pacific.] | ||
* [[:Category:Инерционный калькулятор|Инерционный калькулятор]] | * [[:Category:Инерционный калькулятор|Инерционный калькулятор]] | ||
== [[lw:WOS Solution]] == | == [[lw:WOS Solution]] == | ||
Версия 16:34, 28 ноября 2018
goals[править]
solutions[править]
- The movement of water in the ocean is determined by many factors including tides; winds; surface waves; internal waves, those that propagate within the layers of the ocean; and differences in temperature, salinity or sea level height. Additionally, like high and low pressure systems seen on TV weather maps, the ocean is full of eddies, slowly swirling masses of water... In the future, Qiu and colleagues hope to develop a mathematical approach to creating more detailed pictures of circulation based on sea level in more locations throughout the Pacific.
- Инерционный калькулятор
lw:WOS Solution[править]
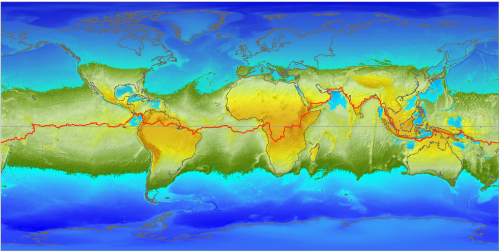
Чтобы красиво представить реконструированную историю, например, для Крыма, нужно иметь детальную карту местности ДО сдвига географического полюса, где будут и рельеф суши, и береговые линии, и морские глубины.
Такую карту можно рассчитать исходя из современных географических данных с помощью физической модели гидросферы и литосферы.
Для выполнения законов Ньютона нужно выбрать инерциальную систему отсчёта. Пусть это будет вид на Землю из космоса. Вращение вокруг оси в такой системе отсчета порождает две силы - центробежную и силу Кориолиса.
Задачи:
- Как будет выглядеть гидросфера после прекращения вращения Земли? Должна получиться карта, подобная
- Построить карту гидросферы для смещения экватора на 18 градусов.
- Рассчитать изменения литосферы при смещении полюсов согласно законов впука-выпука от Камалова .

Подкатегории
В этой категории отображается 3 подкатегории из имеющихся 3.
З
М
Э
Страницы в категории «Моделирование рельефа»
Показаны 3 страницы из 3, находящихся в данной категории.